Why Aether's shared filesystem commits writes faster than its block storage
I ran the first storage benchmark on Aether expecting block to win everywhere. It didn't, and the reason says something about how everyone benchmarks cloud storage.
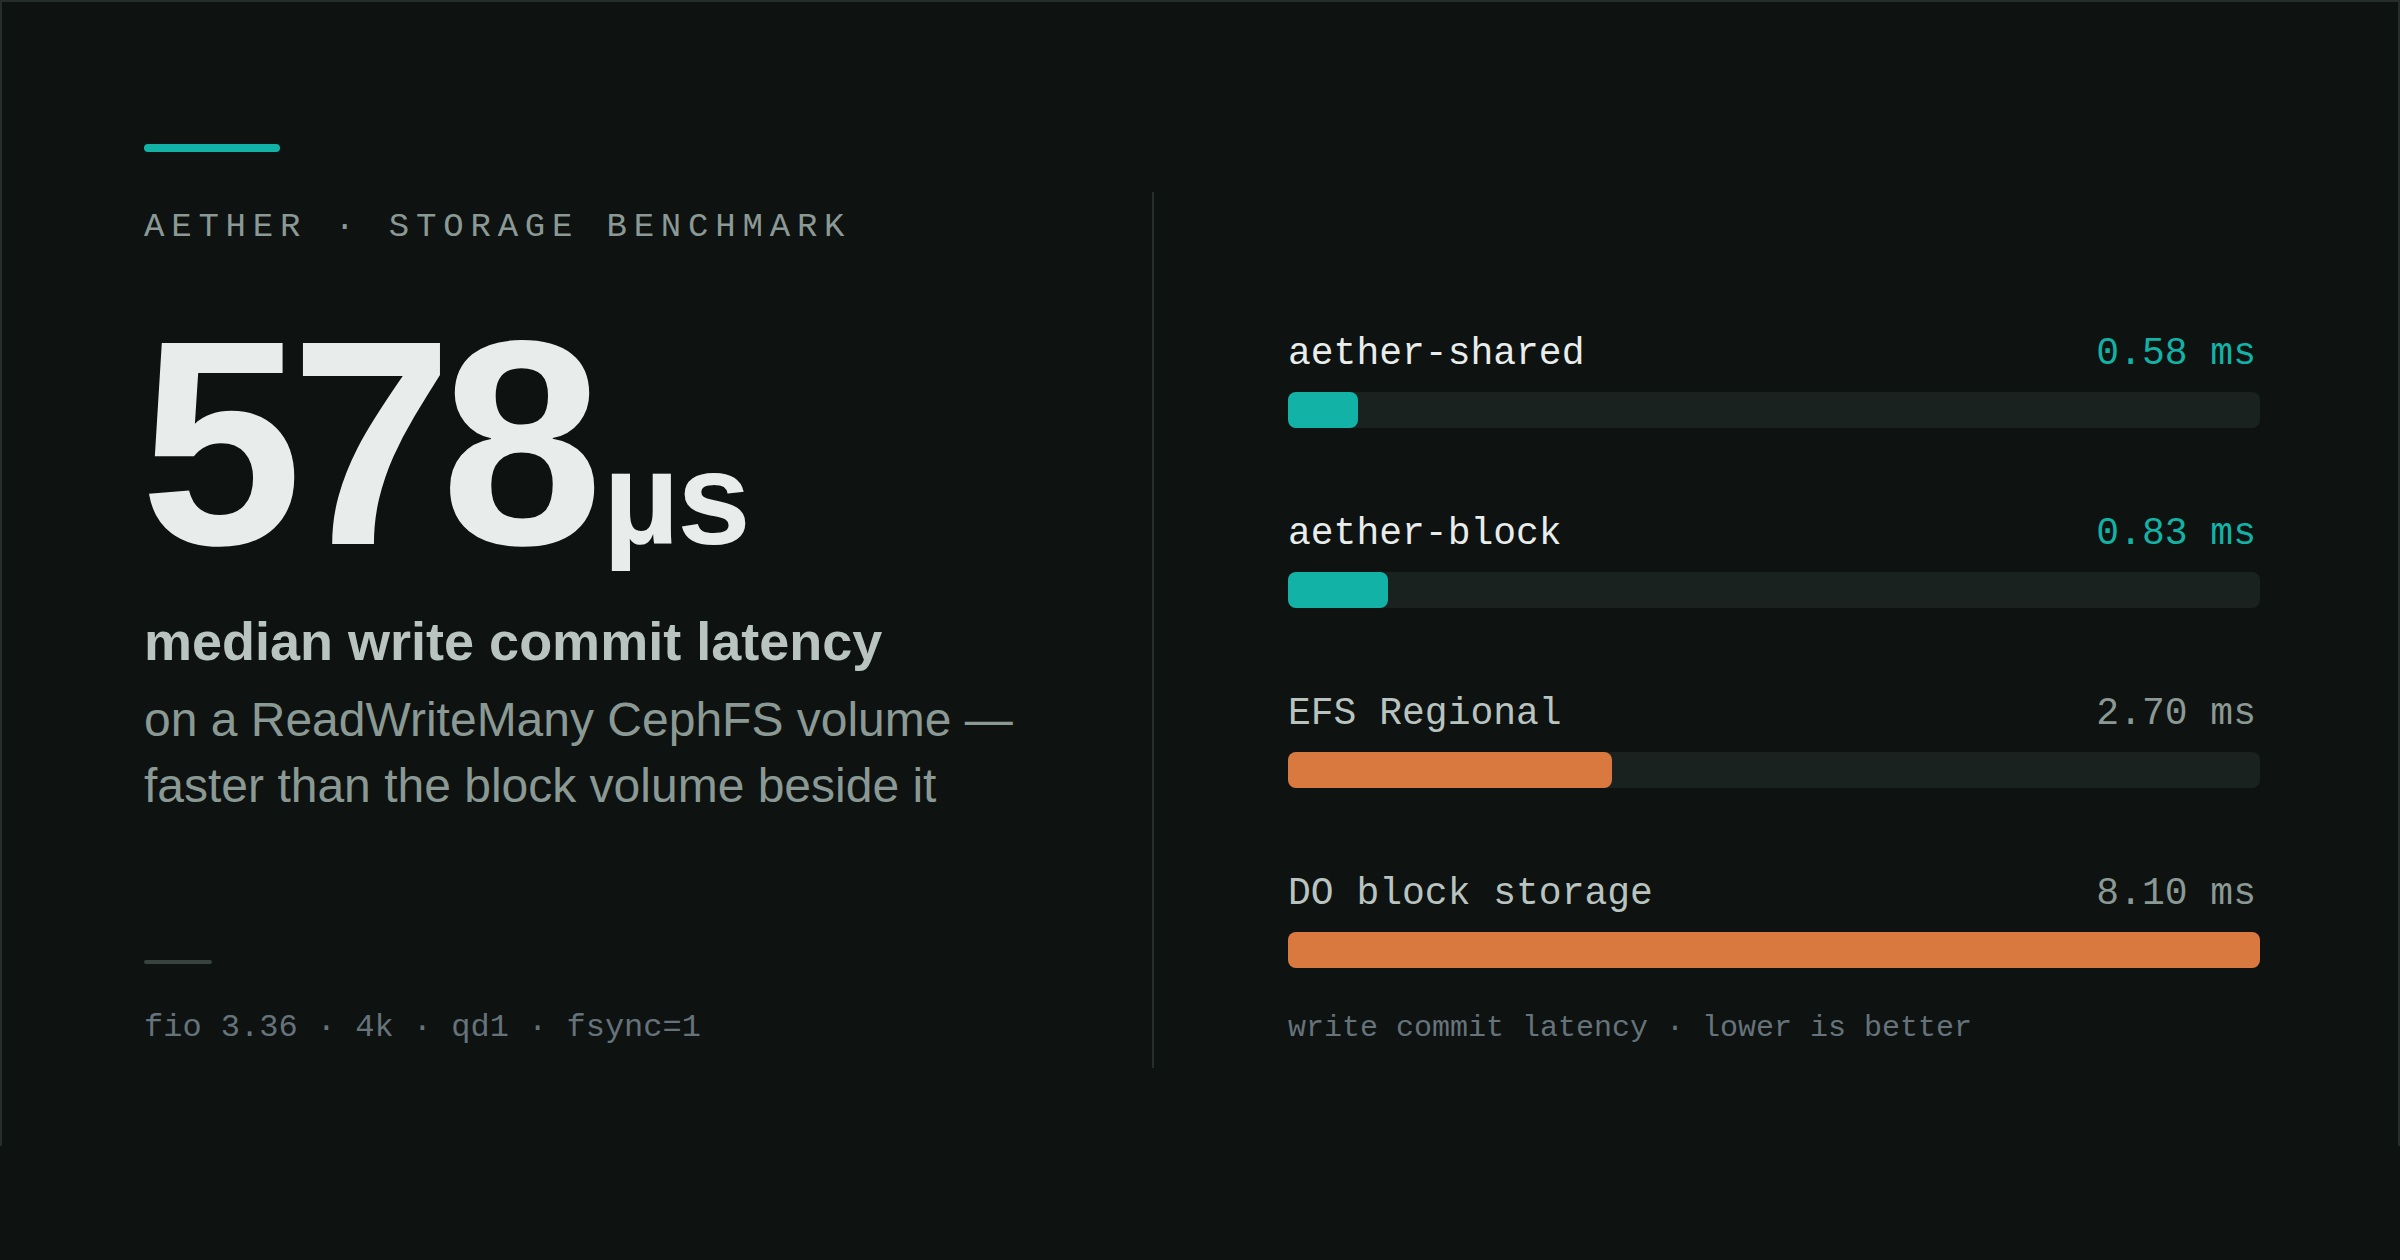
Aether is live, which means I finally have a cluster I can point fio at without apologising for the numbers. So I did the obvious thing and benchmarked both storage classes — aether-block, which is Ceph RBD with ext4 on top, and aether-shared, which is CephFS mounted ReadWriteMany. I expected the block volume to win on everything except the ability to be mounted from two nodes at once. That is the standard trade: you take a shared filesystem when you need shared, and you pay for it in latency.
It did not work out that way. The shared filesystem committed writes about 30% faster than the block volume sitting on the same cluster, backed by the same OSDs, measured in the same run. That result is the reason this post exists, but it is not the only thing the run turned up, and a couple of the other findings are more useful if you are evaluating anyone's storage rather than mine.
What I actually measured
Two nodes, Talos 1.13.6, Kubernetes 1.36. One 100Gi PVC on each storage class, both mounted into the same benchmark pod, plus a second pod pinned by anti-affinity to the other node with the shared volume mounted so I could confirm RWX was doing what it claims across hosts. fio 3.36, O_DIRECT on both volumes, 30 seconds per test with a 5 second ramp, five workloads per volume: sequential write and read at 1M, random write and read at 4k with a queue depth of 64 across four jobs, and a single-job 4k random write with fsync=1 for commit latency.
One detail matters more than it looks. All five workloads reuse the same file set through fio's filename_format, so the working set stays at four jobs times four gigabytes regardless of how many tests I add. Without that, each new workload lays out its own files and a benchmark suite quietly grows until it fills the volume it is measuring — which changes the numbers underneath you as it goes.
Here is what came back.
| Workload | aether-block | aether-shared |
|---|---|---|
| Sequential write, 1M qd16 | 1,066 MiB/s | 1,060 MiB/s |
| Sequential read, 1M qd16 | 1,806 MiB/s | 2,008 MiB/s |
| Random write, 4k qd64 | 78,100 IOPS | 76,600 IOPS |
| Random read, 4k qd64 | 93,500 IOPS | 63,900 IOPS |
| Sync write, 4k qd1 fsync | 825 µs avg | 578 µs avg |
The result I did not expect
That last row is the one. On the block volume, a 4k write with an fsync behind it took 825 microseconds on average, with a 99th percentile of 2,180. On CephFS the same test averaged 578 microseconds with a 99th percentile of 1,270. The shared filesystem was faster on both the median and the tail.
My best explanation is the ext4 journal. On aether-block a synchronous write goes through the filesystem journal before it is acknowledged, and that journal is itself living on a replicated network block device — so the commit path has an extra hop that exists purely because there is a local filesystem in the way. CephFS has no local journal to cross; the client talks to the OSDs and the MDS directly. The block layer buys you a filesystem you control, and on a network-backed volume you pay for it at exactly the moment you care most.
I want to be careful about how far I push this. It is one workload on one cluster, and fsync behaviour is notoriously sensitive to the filesystem, the mount options and the write pattern. But it is enough to make me stop treating "shared means slow" as a default, and if you have been reaching for RWO out of reflex on a Ceph-backed platform, it is worth measuring rather than assuming.
Why both sequential write numbers are identical
Look at the first row again: 1,066 MiB/s against 1,060 MiB/s. Two completely different data paths — a block device with a local filesystem, and a distributed POSIX filesystem — landing within 0.6% of each other is not a storage-engine result. It is a wall that both of them are hitting.
That figure works out to roughly 8.9 Gbit/s, which is close enough to a saturated link that I am fairly confident the sequential write ceiling here is the network and the replicated write path rather than anything about RBD or CephFS. The reads go higher, to 1.8 and 2.0 GiB/s, and that fits the same story: reads do not pay replication and can fan out across more OSDs than a write can. Which is a slightly deflating conclusion for anyone hoping to tune their way out of it — if you want more sequential write throughput on a setup like this, the storage class is not where the problem lives.
The queue depth trap in every benchmark you read
While I was collecting comparison figures I found a published Google Cloud result that I think is the single most useful thing in this whole exercise. Someone provisioned a Hyperdisk Balanced volume for 160,000 IOPS and measured 24,100. The disk was not broken and the provisioning was not a lie. They ran fio with one job at a queue depth of 32, and at that depth you simply cannot keep a network-attached device busy — by Little's Law you would need something like 320 requests in flight to reach the provisioned figure.
My run used four jobs at a queue depth of 64, so 256 in flight, which is why my random read number has a nine in front of it. That is not me being clever, it is me having enough concurrency to expose what the storage can do. The lesson runs in both directions and it is worth internalising before you compare anyone's numbers to anyone else's. A shallow-queue benchmark understates every network-attached storage system, including mine. And a deep-queue number should never be set next to a shallow-queue number as though they measure the same thing — which, if you go looking, is exactly what a lot of published comparisons do.
If you want to run this against your own storage, this is the configuration:
--filename_format=bench.$jobnum --group_reporting --time_based
--runtime=30 --ramp_time=5 --randrepeat=0 --norandommap
--ioengine=libaio --direct=1

--rw=write      --bs=1M --size=4G --numjobs=4 --iodepth=16 --end_fsync=1
--rw=read       --bs=1M --size=4G --numjobs=4 --iodepth=16
--rw=randwrite  --bs=4k --size=4G --numjobs=4 --iodepth=64 --end_fsync=1
--rw=randread   --bs=4k --size=4G --numjobs=4 --iodepth=64
--rw=randwrite  --bs=4k --size=4G --numjobs=1 --iodepth=1  --fsync=1
Probe O_DIRECT before you start. Some shared filesystems reject it, and a silent fall back to buffered I/O will hand you beautiful numbers that mean nothing.
The 4.2 second stall I cannot explain yet
Both read tests on the shared volume recorded a worst case of around 4.2 seconds. Not 4.2 milliseconds — the 99.99th percentile came in at 4,211 ms against an average of about 4 ms, with submission latency variance to match. The block volume's worst case over the same period was 25 ms.
One stall in a thirty second window is invisible in a throughput average and extremely visible to anything latency-sensitive that happens to be running when it lands. My suspicion is an MDS cap revocation or a metadata round-trip rather than anything in the data path, but I want to be clear that this is a hypothesis and not a finding. The next test is a longer latency-focused soak with MDS metrics recorded alongside it, and I will write up whatever it turns out to be.
I am including it here because a benchmark post that only contains the flattering numbers is an advertisement. This one is a real open issue on my own platform and I would rather describe it myself than have someone else discover it.
What this does not prove
The cluster was twenty minutes old and had exactly one workload on it. There was no fragmentation, no accumulated metadata, no rebalance in flight and no other tenant competing for the same OSDs. The tests were thirty second bursts, long enough to clear the ramp and nowhere near long enough to expose throttling or sustained-load behaviour. Two clients, two storage hosts, a sixteen gigabyte working set small enough that OSD-side caching may well be contributing to the sequential read figures.
So these are capabilities observed once under favourable conditions. A metered volume from a large provider will deliver its rated IOPS whether or not the rack is busy, because that rating is a commitment. Nothing above is a commitment; it is a measurement, and the honest version of the comparison is that I have shown a ceiling while they publish a floor. The test I care about next is contention — the same commit latency measurement with deliberate noisy neighbours hammering the same pool — because that is the number that decides whether any of this holds up in production, and I would rather find it than have a customer find it.